OEE is a gold standard for measuring manufacturing productivity. Sustaining good OEE is a high priority in shop floors. Availability, performance and quality are the principal factors for OEE. A major factor contributing to OEE is down time of machines. Real-time and in-depth monitoring will aid to identify key reasons causing these downtimes.
IOT project (TPM-Trak) for OEE analysis has been deployed by AMIT. 10 machines currently machining
Liner component, which has 4 operations and raw materials sequenced by 2 parting machines have been monitored over a period of 15 days.
We have compiled a report that identifies factors impacting OEE on the pilot line. Key observations are:
- Insert change is the pre-dominant reason affecting the production process. Frequency of insert change occurrence and time lapsed by operator to fix new insert is high.
- Operator losses like unpunctuality in starting and ending machining during Shift change.
- Excess Lunch time is contributing to decreased availability of the machine.
- No load is one of the management loss resulting in lag of production process.
- Running load is causing high unload time and wait time as operators wait for the component to cool down, thus decreasing performance of the machine.
Suggested Initiatives to address the above may be undertaken to stabilize the process flow.
- Tool life monitoring is being implemented to capture tool change frequency data, supervisor-operator communication to be increased, inserts must be made available to operator from stores quickly in an organized way.
- Time Discipline need to be maintained by the operators during tea time, lunch, initial and last hours of the shift.
- Load and running issues can be minimized by management by managing work flow.
- Some other minor reasons are machine breakdown, tooling problem, operators absent. These things have to be escalated quickly keeping machine hr./rate in consideration.
There has been a
notable increase in OEE comparatively from the day of TPM-Trak software deployment, from an average of
58% to 71%, arising from increased awareness at all levels.
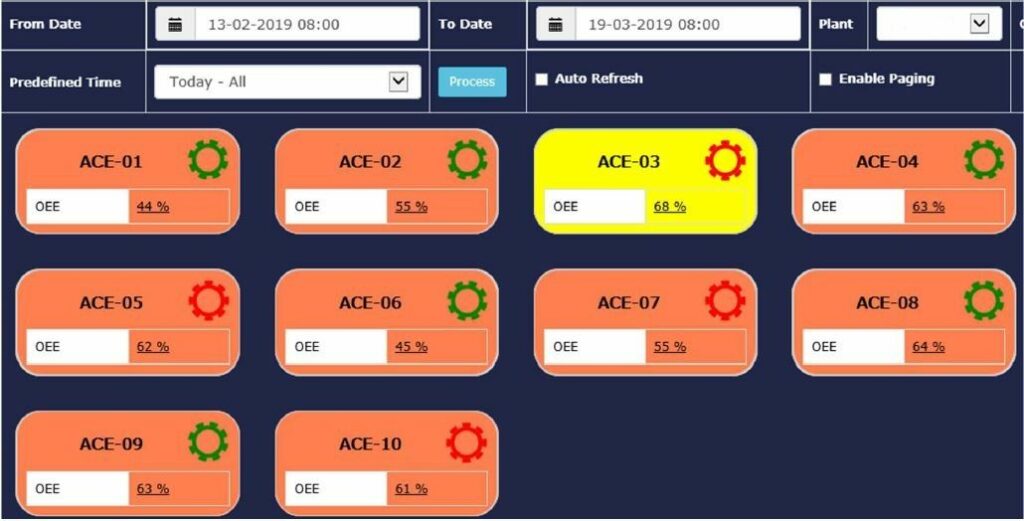
Week 1: Average – 58%; Minimum – 44%; Maximum – 68%
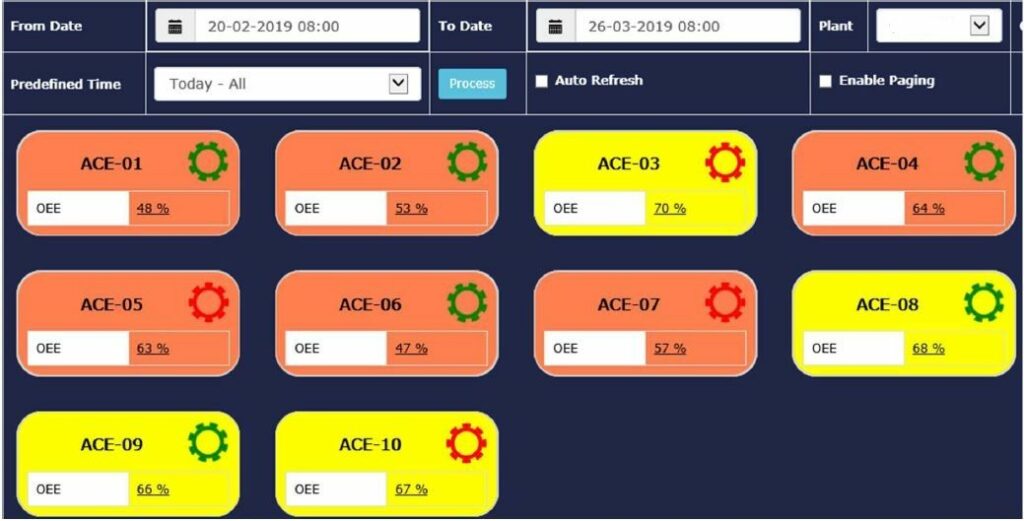
Week 2: Average – 60%; Minimum – 47%; Maximum – 70%
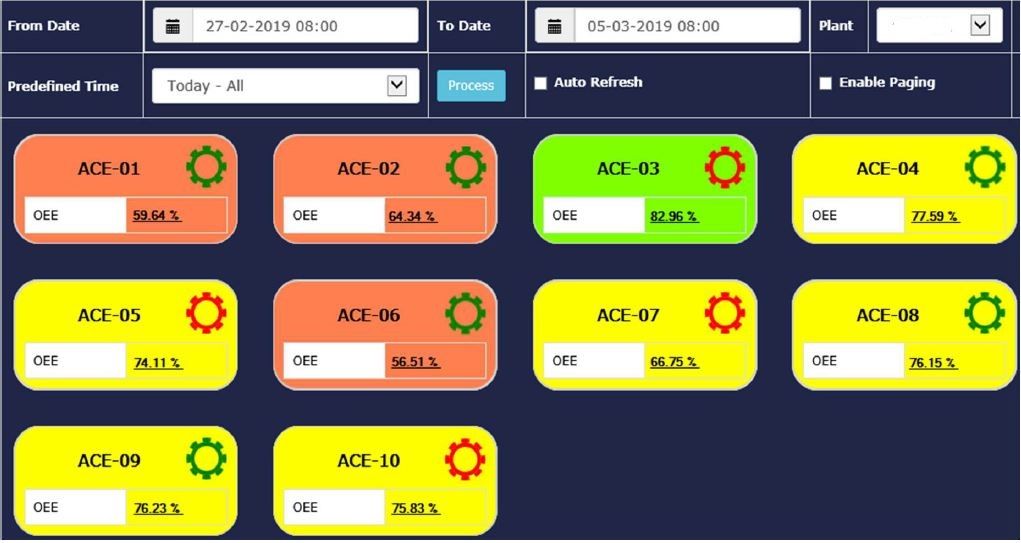
Week 3: Average –
71%; Minimum –
56%; Maximum –
83%
Further if the corrective measures are implemented for reducing the recorded downtime, a drastic improvement in uptime and performance of machines can be observed leading to higher OEE, returns and thus the work flow can be smoothened.
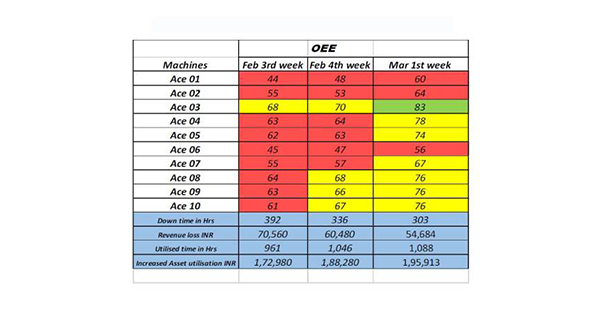
OEE ANALYSIS
Results of automated OEE monitoring for a duration of three weeks
|
OEE |
| Machines |
Feb 3rd week |
Feb 4th week |
Mar 1st week |
| Ace 01 |
44 |
48 |
60 |
| Ace 02 |
55 |
53 |
64 |
| Ace 03 |
44 |
48 |
60 |
| Ace 04 |
68 |
70 |
83 |
| Ace 05 |
62 |
63 |
74 |
| Ace 06 |
45 |
47 |
56 |
| Ace 07 |
55 |
57 |
67 |
| Ace 08 |
64 |
68 |
76 |
| Ace 09 |
63 |
66 |
76 |
| Ace 10 |
61 |
67 |
76 |
| Down time in Hrs |
392 |
336 |
303 |
| Revenue loss INR |
70,560 |
60,480 |
54,684 |
| Utilised time in Hrs |
961 |
1,046 |
1,088 |
| Increased Asset utilisation INR |
1,72,980 |
1,88,280 |
1,95,913 |
February 3rd Week:
 February 4th Week:
 March 1st Week:
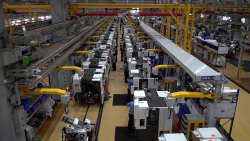
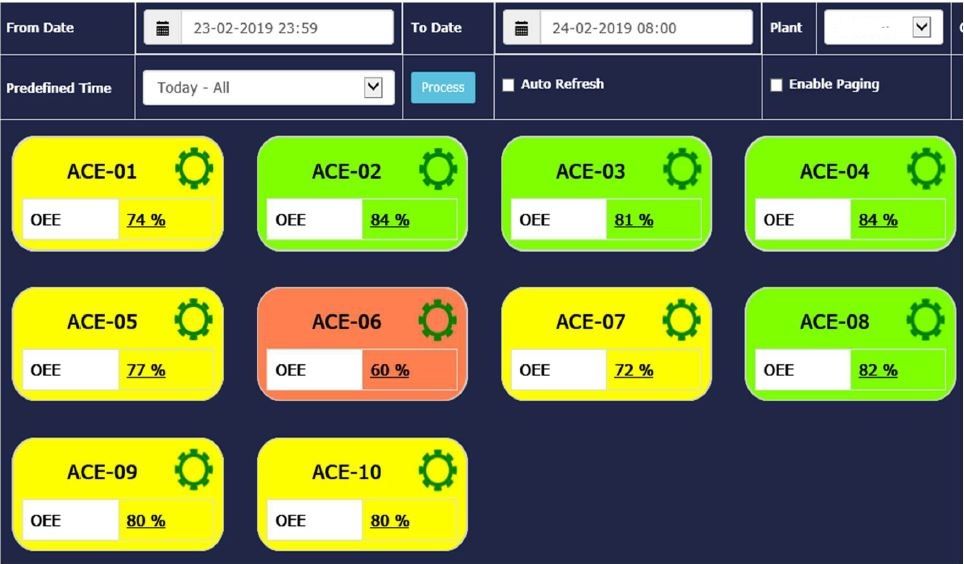
 On 23rd Feb 3rd shift the plant performance was at its best, expected target was almost achieved.
Fig 1 represents the capability of AMIT.
On 23rd Feb 3rd shift the plant performance was at its best, expected target was almost achieved.
Fig 1 represents the capability of AMIT.

 India
India
 China
China
 Europe